When creating custom reports, they can either be call reports or order reports. This article discusses creating a call report, if you want more information on order reports, see this article on the support pages.
In your Admin account:
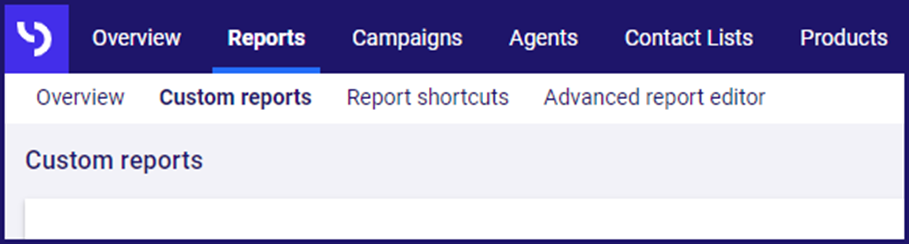
- Click to select the Reports page from the top menu.
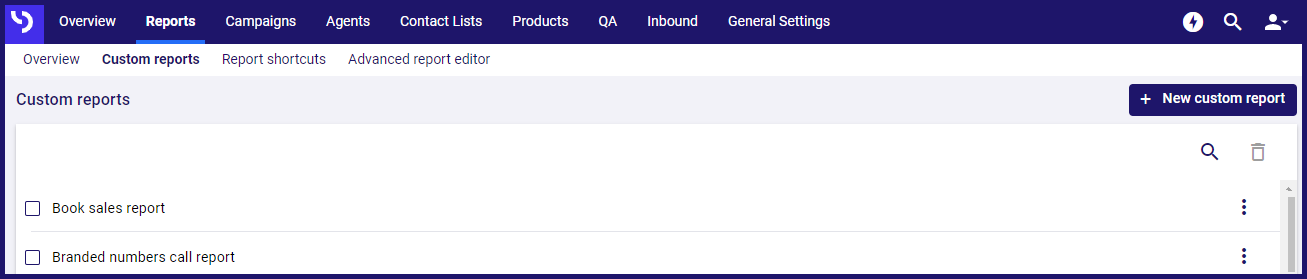
- Click to view Custom reports.
- To create a new report, click the
 button in the top right.
Report basics
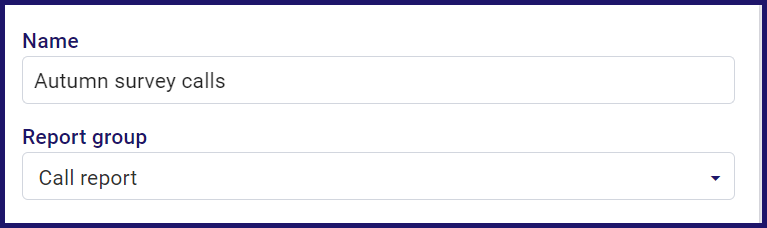
- In the Name field, type a name for your report. Try to make it meaningful, particularly if you have a lot of custom reports, or will only use this report occasionally.
- To create a call report, click the Report group drop-down list and select Call report.
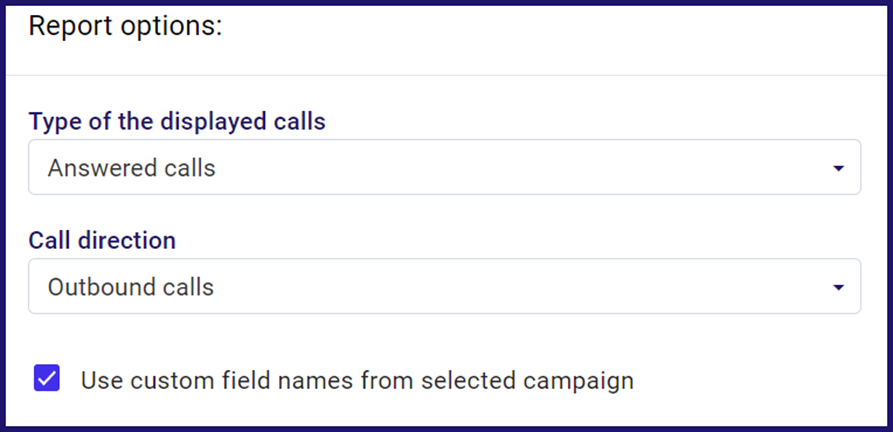
You can then use the Report options section to define what sort of calls should appear in the report:
- Click the Type of displayed calls drop-down list to select to see answered or unanswered calls, or only finalized calls. This defaults to All calls.
- Click the Call direction drop-down list to choose outbound calls, inbound calls, or both. This defaults to Inbound and outbound calls.
- By default, Use custom field names from selected campaign is ticked. If you have renamed any of the “Other info” fields for a project, having this ticked will show your field names in the report. For example, if you have renamed the field name “Other info 1” to “Membership level”, the report would reflect that.
Note that any changes to the standard fields, like First name, Email and City will not show in the report.
- You can use the Sorting column and Sorting order drop-down lists to choose the ordering of your data.
Building the report you want
Once you have defined the basics of your report, you can now configure precisely what information should show in it. This can be done with or without Grouping.
Grouping
By default, the report will show an individual line for each call within its parameters, for example the duration of each call for each agent. Often, it is more useful to see a total or an average. For example, you might want to see the total duration of all calls for an agent, or the average duration of all their calls. To create the second type of report, use Grouping.
- Click the
 toggle to enable grouping.
 - Click Add grouping to choose which groups to use.
- Click to tick the checkbox for one or more groups from the list.
- Click outside the list to finish.
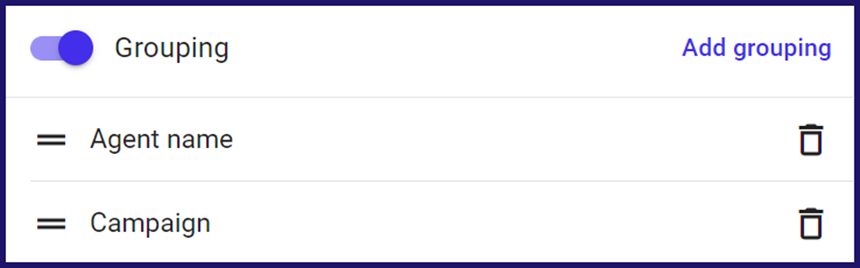
- If you have added a group by mistake, click
 to remove it.
 - You can change the order of the groups by clicking and dragging
 by the group’s name.
Add columns
You cannot save a report until you have added at least one column to it. If you have not used grouping, you will have many more options.
- Click Add columns.
- Click to tick the checkbox for the columns you wish to use.
- Click outside the list to finish.
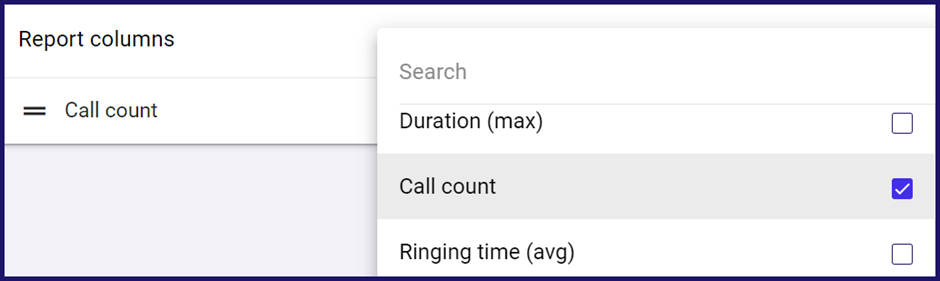
- If you have added a column by mistake, click to remove it.
- You can change the order of the columns by clicking and dragging by the column’s name.
- Once all columns have been selected and arranged, click
 in the top right.
Saving and running the report
Once the report has been saved, you will be taken to the screen to run the report. Before you do, there are several further options.
- Filter the report, by clicking the available drop-down lists. For example, you may only want to run this report for a particular office or contact list.
- Click the Time period drop-down list. You can select a specific date range by choosing Numeric date and typing the dates. It is usually better to choose a “literal date”, for example Previous week or This month.
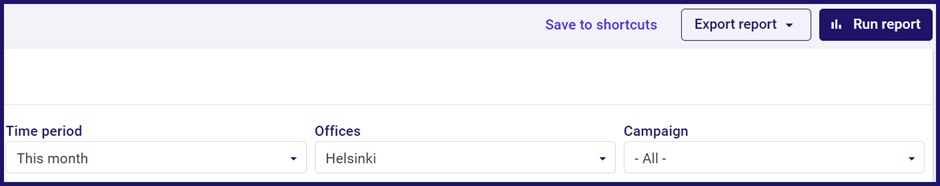
- If you choose a literal date for Time period, you can click Save to shortcuts. This will make it easier to find and run the report in the future.
- You can then either click
 , or
, or  , to output the report to, for example, a CSV file.